最近我发现 Simulink 有一个文档里没有说明的特性:在模块封装的图标绘制命令中可以画粗线。
图标绘制命令中 plot 的局限
封装中的 plot 函数是一个精简版的绘图函数。若给它指定 linewidth 参数,会报错:
Invalid arguments passed to 'plot' drawing command in block 'block_path'. Plot command accepts only numbers as valid arguments.帮助文档中对 plot 的描述是
plot(Y) plots, for a vector Y, each element against its index. If Y is a matrix, it plots each column of the matrix as though it were a vector.

plot(X1,Y1,X2,Y2,...) plots the vectors Y1 against X1, Y2 against X2, and so on. Vector pairs must be the same length and the list must consist of an even number of vectors.

Plot commands can include NaN and inf values. When Simulink® software encounters NaNs or infs, it stops drawing, and then begins redrawing at the next numbers that are not NaN or inf. The appearance of the plot on the icon depends on the units defined by the Icon units option in the Mask Editor.
一个未写入文档的画粗线方法
我无意中发现,当 plot 输入参数中的第一对元素与第二对元素相同时,plot 会画出一条粗线;否则画出的是较细的线。即:
if X1(1)==X1(2) && Y1(1)==Y1(2)
    % draw bold line
else
    % draw thin line
end
因此,我们可以用 plot 函数画出粗边框,而不是细边框。
示例
自定义的低通滤波器模块
x = linspace(0,1,100);
y = x./sqrt(x.^2 + 0.01);
plot(1-x,y);
plot([0 0 1 1 0 0]*0.98,[0 0 0 1 1 0]+0.02);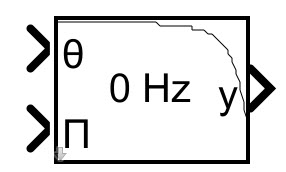
自定义的常数输入模块
pos    = get_param(gcb,'Position');
width  = max(1,abs(pos(3)-pos(1)));
height = max(1,abs(pos(4)-pos(2)));

scale  = height / width;
right  = 1 - 1/width;
bottom = 1/height;

plot([0 0 right-0.2*scale right right right-0.2*scale 0 0],[bottom bottom bottom 0.2 0.8 1 1 bottom]);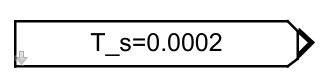
自定义的单位延迟模块
width  = max(1,abs(pos(3)-pos(1)));
height = max(1,abs(pos(4)-pos(2)));
scale  = height / width;
right  = 1 - 1/width;
bottom = 1/height;

dpoly([1],[1 0],'z');

plot([0 0 0.2*scale right-0.2*scale right right right-0.2*scale 0.2*scale 0 0],[0.2 0.2 bottom bottom 0.2 0.8 1  1 0.8 0.2]);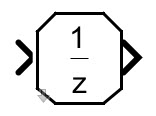


0 条评论